In this series of posts I have been greatly aided by Lincoln Mullen, assistant professor at George Mason University and a frequent collaborator with the Roy Rosenzweig Center for History and New Media there. You can find additional information on this post, including all the coding where we “show our work,” at its associated RPub.
A nice feature of R Studio is that we can quickly visualize matching n-grams with density plots. In the future, we will want to hone in on particular passages to see if certain parts of the code (sections on pleading as opposed to evidence, for instance) had more influence than others. At the outset of the project, it’s nice to use density plots to eyeball the extent of textual borrowing, and the approximate spacing of the borrowings throughout the codes. Doing so can generate a number of hypotheses we can then test with more refined tools.
Let’s start by comparing California’s first code (1850) with the first two drafts of the New York code. Just counting up the number of matching n-grams indicates that California matches 22.5% of the n-grams in both the 1848 and the 1849 New York code. So which version was California drawing from? 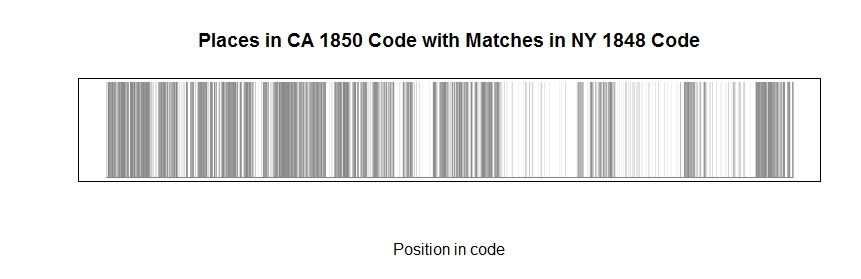 Continue reading