In this series of posts I have been greatly aided by Lincoln Mullen, assistant professor at George Mason University and a frequent collaborator with the Roy Rosenzweig Center for History and New Media there. You can find additional information on this post, including all the coding where we “show our work,” at its associated RPub.
A nice feature of R Studio is that we can quickly visualize matching n-grams with density plots. In the future, we will want to hone in on particular passages to see if certain parts of the code (sections on pleading as opposed to evidence, for instance) had more influence than others. At the outset of the project, it’s nice to use density plots to eyeball the extent of textual borrowing, and the approximate spacing of the borrowings throughout the codes. Doing so can generate a number of hypotheses we can then test with more refined tools.
Let’s start by comparing California’s first code (1850) with the first two drafts of the New York code. Just counting up the number of matching n-grams indicates that California matches 22.5% of the n-grams in both the 1848 and the 1849 New York code. So which version was California drawing from? 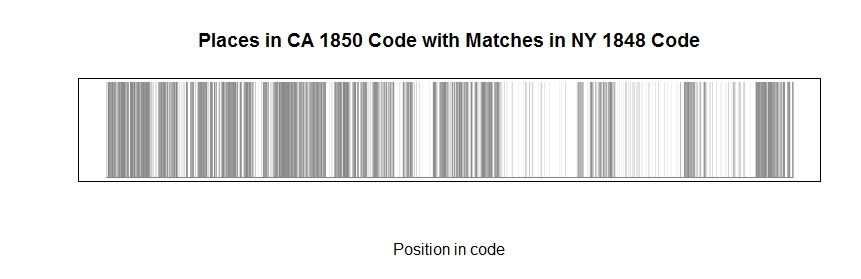
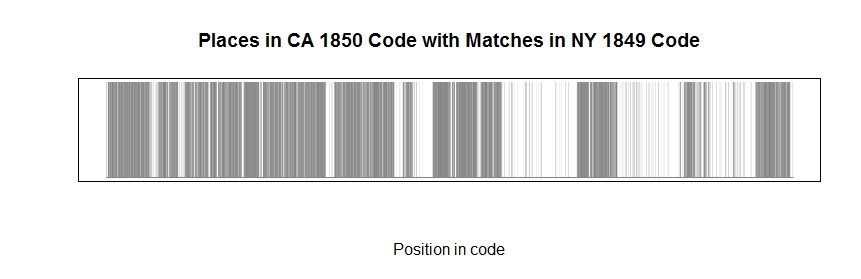
The heavier shading in the second comparison indicates that 1849 was the borrowed New York code. Though the number of matching n-grams is similar for both versions, the distribution in the second plot seems more consistent with the thesis that California was using the fuller, amended version of New York’s code.
Now let’s just run through some regional comparisons and see if anything interesting pops out. Here are the codes from a number of western states compared to the final draft of the New York code: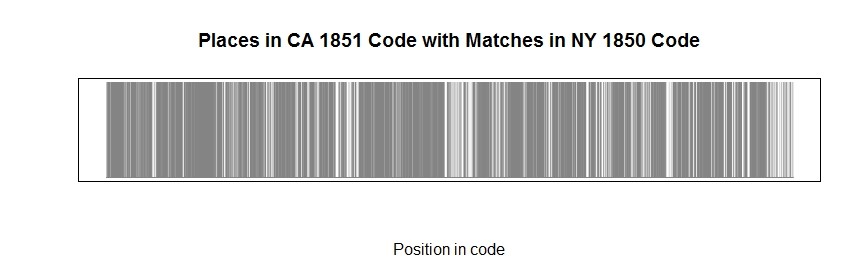
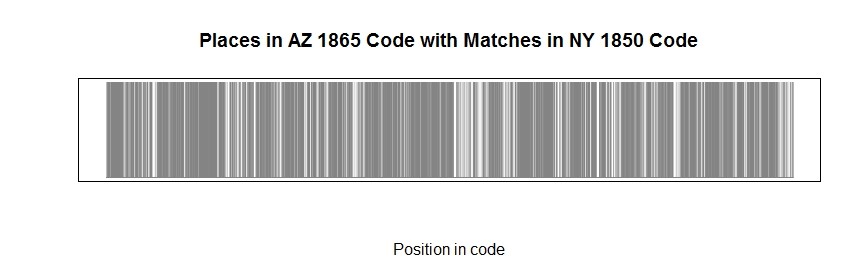
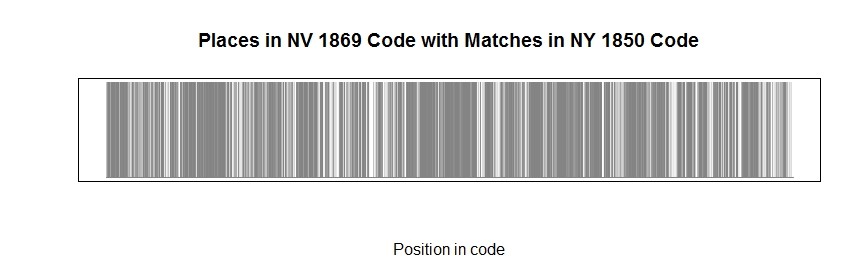
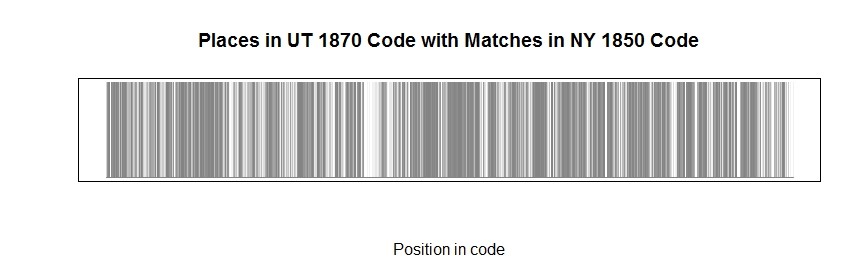
All of these have very high incidents of matching the New York code, but visually we can see that a couple of these codes match each other even more closely. Note how the density pattern is almost exactly the same between California and Arizona, Nevada and Utah. We can generate a hypothesis: Though New York law was clearly influential in the West, some (maybe most) states did not copy from a New York statute book but rather from a much closer neighbor.
Here’s the South: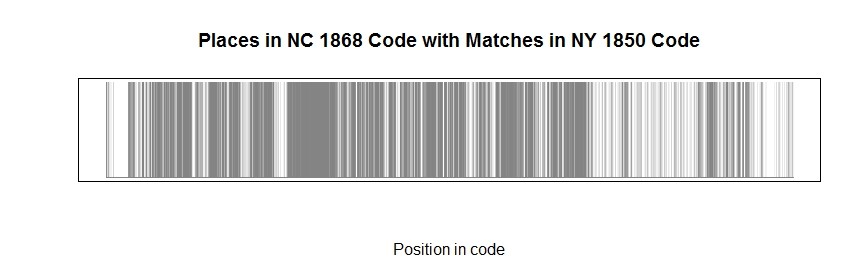
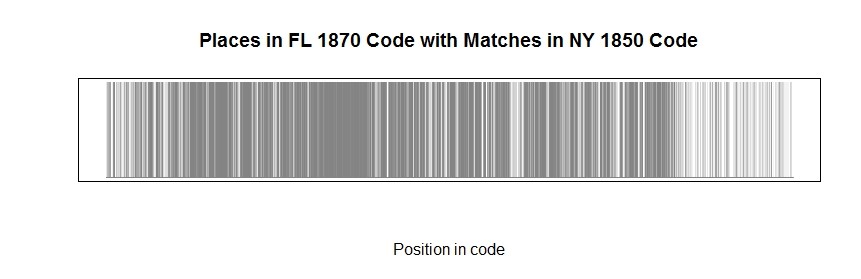
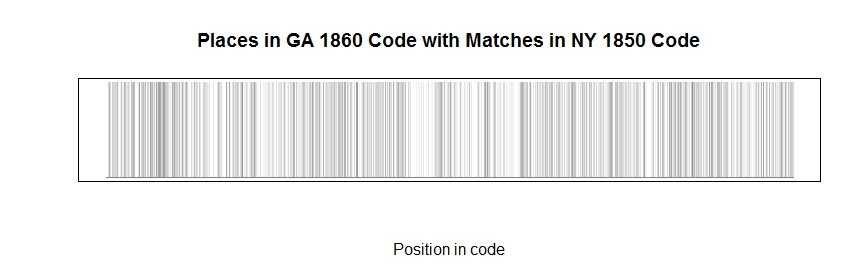
Georgia’s plot is consistent with random noise–a bunch of false positive because the two documents happen to be discussing the same subject (civil procedure) incidentally using common expressions. Note that again the distribution between North Carolina and Florida is fairly similar. Clearly the influence of New York law in the South was quite different after the Civil War, as any historian of Reconstruction would suspect.
And the Midwest: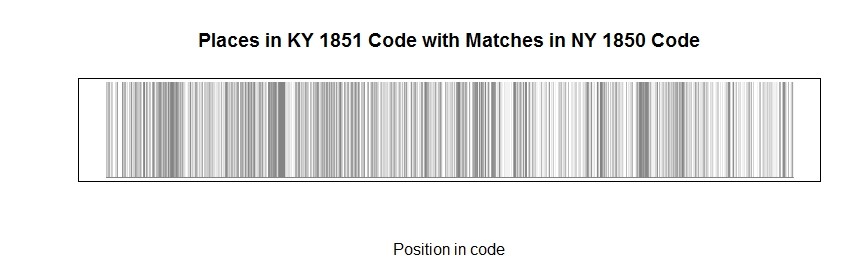
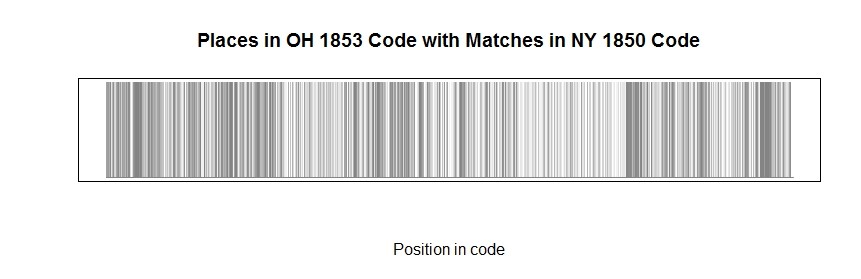
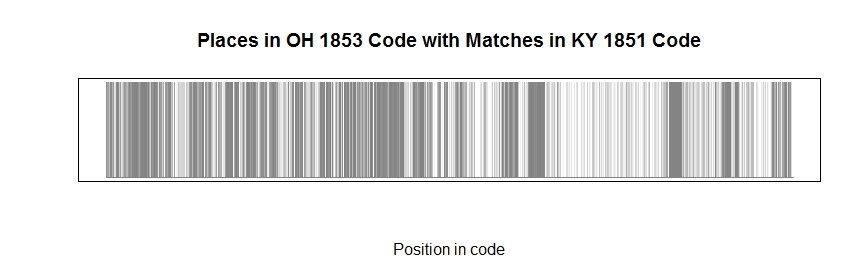
Here the legislative borrowings from New York are much more spotty. Note the third comparison is not with New York but with another midwestern state, with a bit denser distribution of shared provisions. Thus it seems that though New York reforms might have been influential, the statutory text was not, and we will likely find a more regionally influential jurisdiction once all codes are n-grammed and compared.
So what can we hypothesize from this quick eyeballing? New York was quite influential, but in most cases, the text was borrowed not directly from New York but from a neighboring jurisdiction. The midwestern comparison might indicate either that New York’s influence grew over time, or that New York law had disparate regional influence. Given that the developing West and the re-developing Reconstruction South have the highest correlations with New York’s code, further investigation may reveal a strong economic influence behind the migration of New York law.